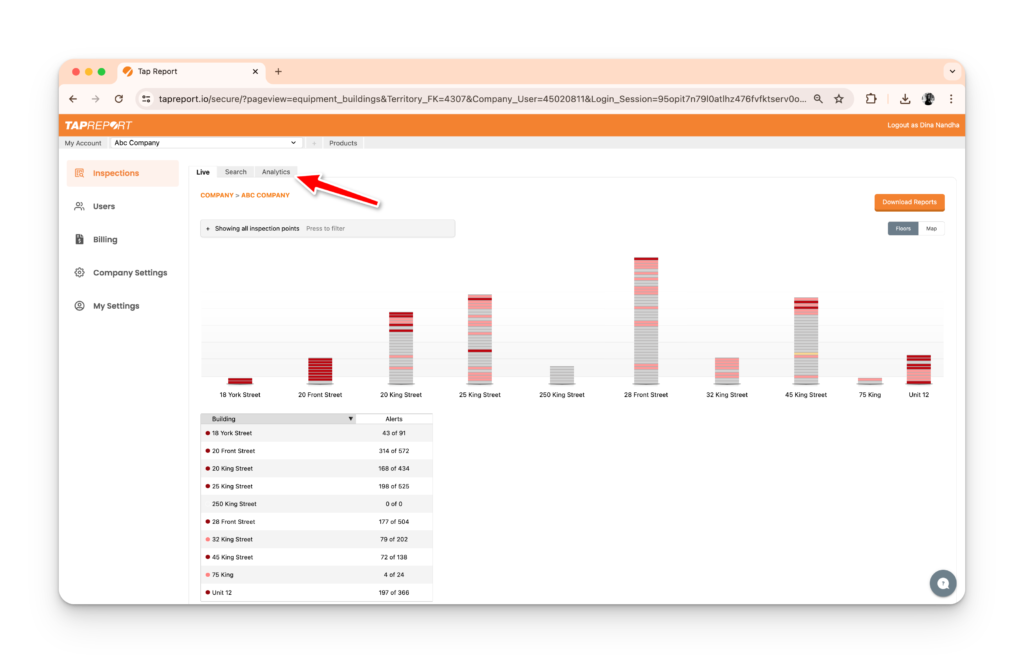
- From your logged-in account, click on the Property Connection tab that you would like to view Inspection Analytics for (excluding your My Account Tab)
- Click on Inspections from the Main Menu
- Click on the Analytics tab


The first bar graph is a great way to pinpoint which buildings have an issue and the line graph shows the trend of inspections completed on-time. These graphs are an excellent way of providing different details on submitted issues. With the circle graphs, you can see submitted issues by project and cause code. With the bar graphs, you can see submitted issues by type and user’s with late inspections.